For six months my desktop was haunted. Random reboots, sometimes landing back on the BIOS splash screen like nothing happened. Blue screens weeks apart, each one with a different stop code. I rebuilt my mental model of the machine five times: it’s the RAM, no wait, it’s the SSD, no, it’s a driver, maybe the PSU is sagging. At one point I had genuinely started pricing a new build, because chasing a ghost you can’t reproduce is the most demoralizing kind of debugging there is.
Then one afternoon I stopped guessing and actually read what the machine had been telling me the whole time. It turned out my i9-14900K was dying, quietly, one core at a time. And Windows had been keeping receipts.
The part where I suspected everything except the truth
The specs, for context: an i9-14900K on a Gigabyte Z790 AORUS ELITE AX, 64 GB of DDR5, Windows 11 24H2. No overclock, not even XMP, everything on board defaults. The kind of machine that has no business being unstable.
The first blue screen came in February, while clangd was indexing a codebase: KMODE_EXCEPTION_NOT_HANDLED. Annoying, but fine, one-off. Then a KERNEL_SECURITY_CHECK_FAILURE the same month. March: PAGE_FAULT_IN_NONPAGED_AREA. April: SYSTEM_SERVICE_EXCEPTION. August: a HYPERVISOR_ERROR, which I didn’t even know was a thing you could get, while Discord was open.
Five crashes, five different stop codes, five different processes. If you’ve done this dance before, you know the script: run memtest (passed), update drivers (nothing), stare at temperatures (fine), question your life choices (ongoing). Software bugs are creatures of habit — they crash in the same place, the same way, every time. These crashes had no habit at all. I just didn’t appreciate yet what that actually meant.
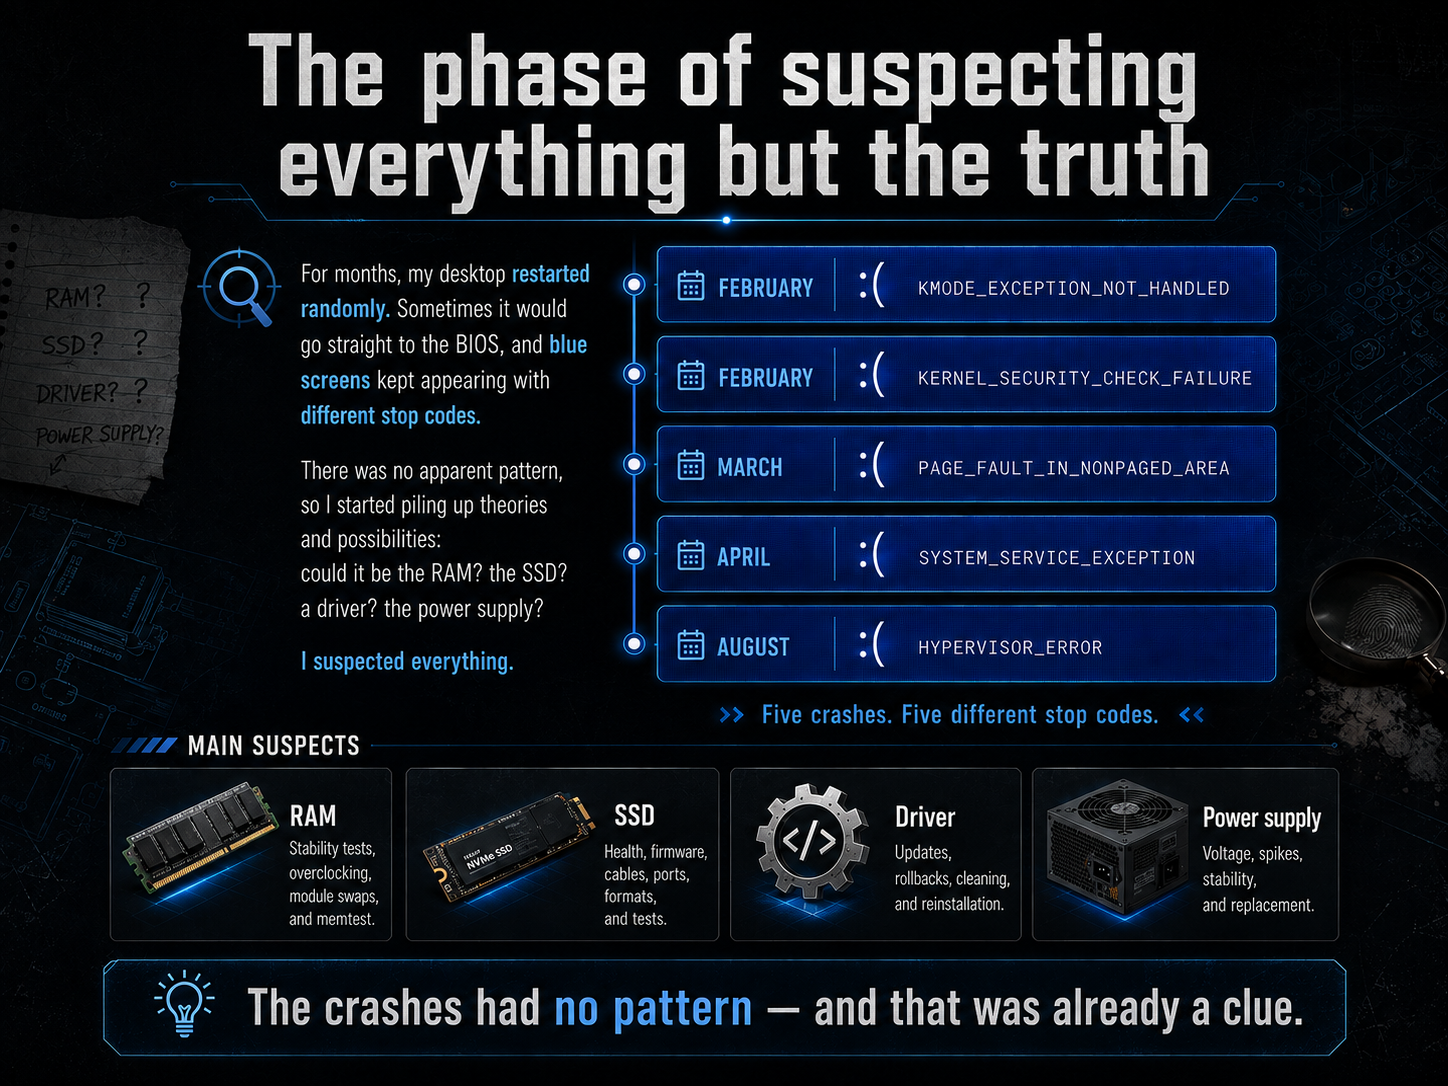
By mid-August the machine was rebooting on its own without even bothering to bluescreen first. That was the week I almost gave up on it.
Reading what the machine was actually saying
The turning point was embarrassingly simple: I opened Event Viewer and, instead of looking at the crashes, I looked at what happened around them. Buried in the System log were entries from a source I’d never paid attention to: WHEA-Logger, Event ID 19 — “A corrected hardware error has occurred.”
WHEA is the Windows Hardware Error Architecture. Event 19 means the CPU itself detected an internal error, fixed it on the fly, and filed a report. The machine doesn’t crash — you’d never know it happened. Pulling all of them takes one PowerShell command:
Get-WinEvent -FilterHashtable @{
    LogName      = 'System'
    ProviderName = 'Microsoft-Windows-WHEA-Logger'
    Id           = 19
} | Format-List TimeCreated, Message
There were 27 of them. Twenty-one said internal parity error, six said Translation Lookaside Buffer error, all reported by “Processor Core”. And every single event carried one of two numbers in its details: APIC ID 32 or APIC ID 33.
Twenty-seven errors. Two APIC IDs. Nothing else, anywhere, in months of logs.
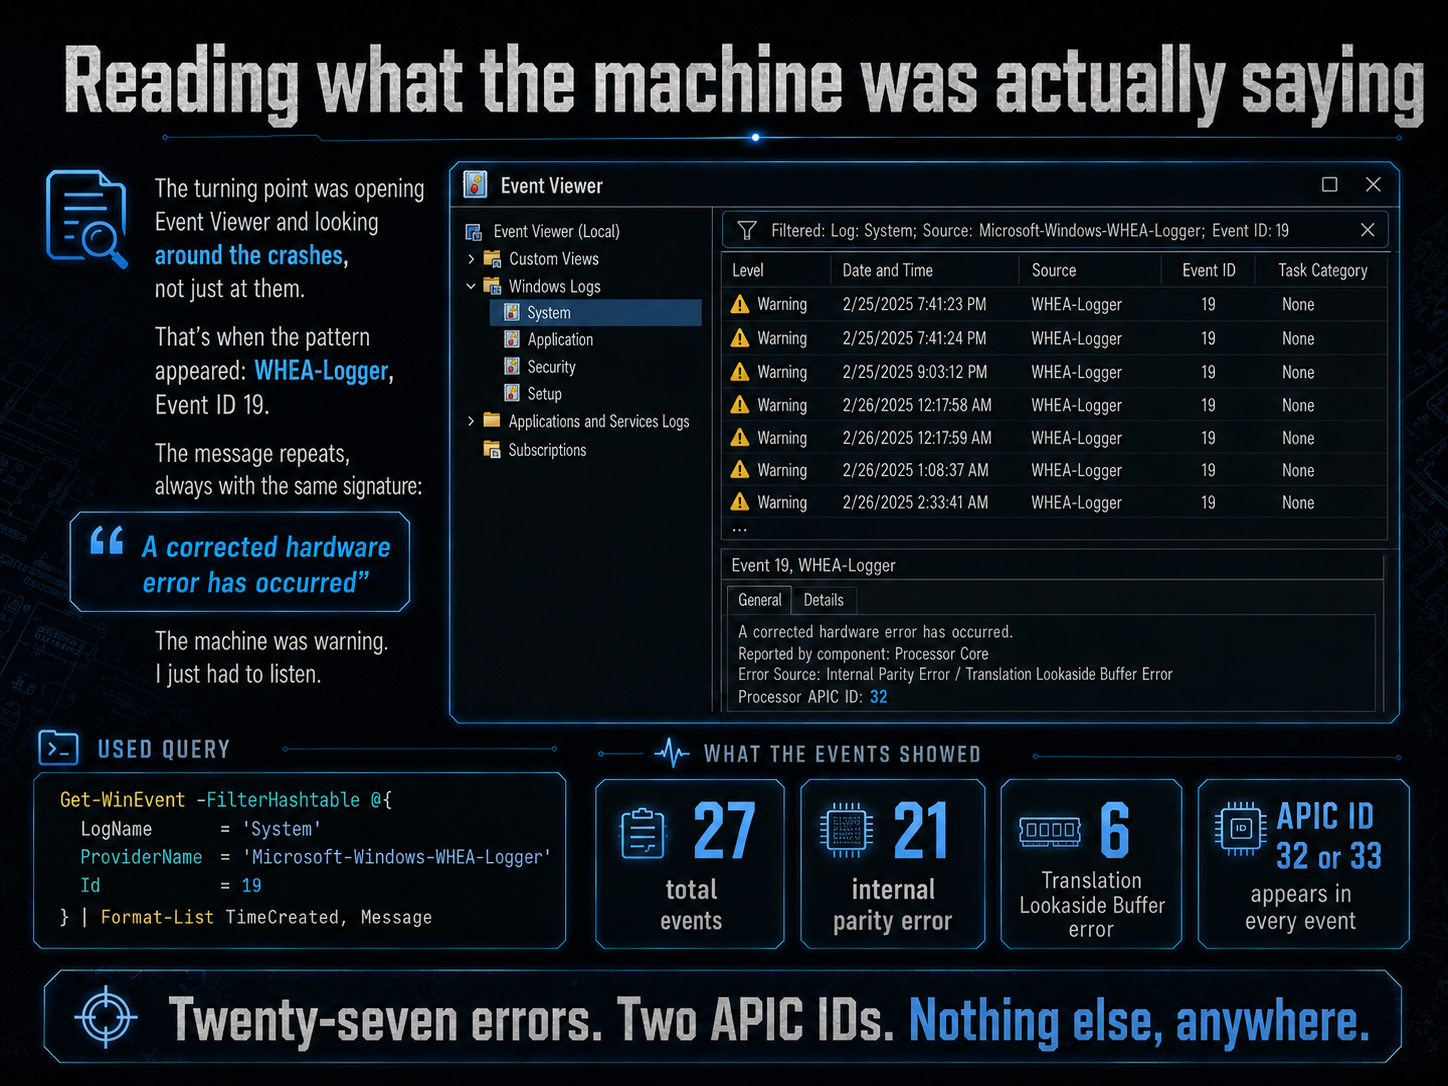
That pattern is the whole story, and here’s why: everything I’d been blaming — PSU, RAM, motherboard, cooling — is shared infrastructure. If the power delivery were flaky, errors would land on random cores. If the RAM were bad, corruption would follow whichever core touched the bad address. A failure that only ever hits the same two logical processors, while their 30 siblings stay spotless, isn’t coming from outside the chip. It’s a defect in one specific patch of silicon.
Two APIC IDs, one core
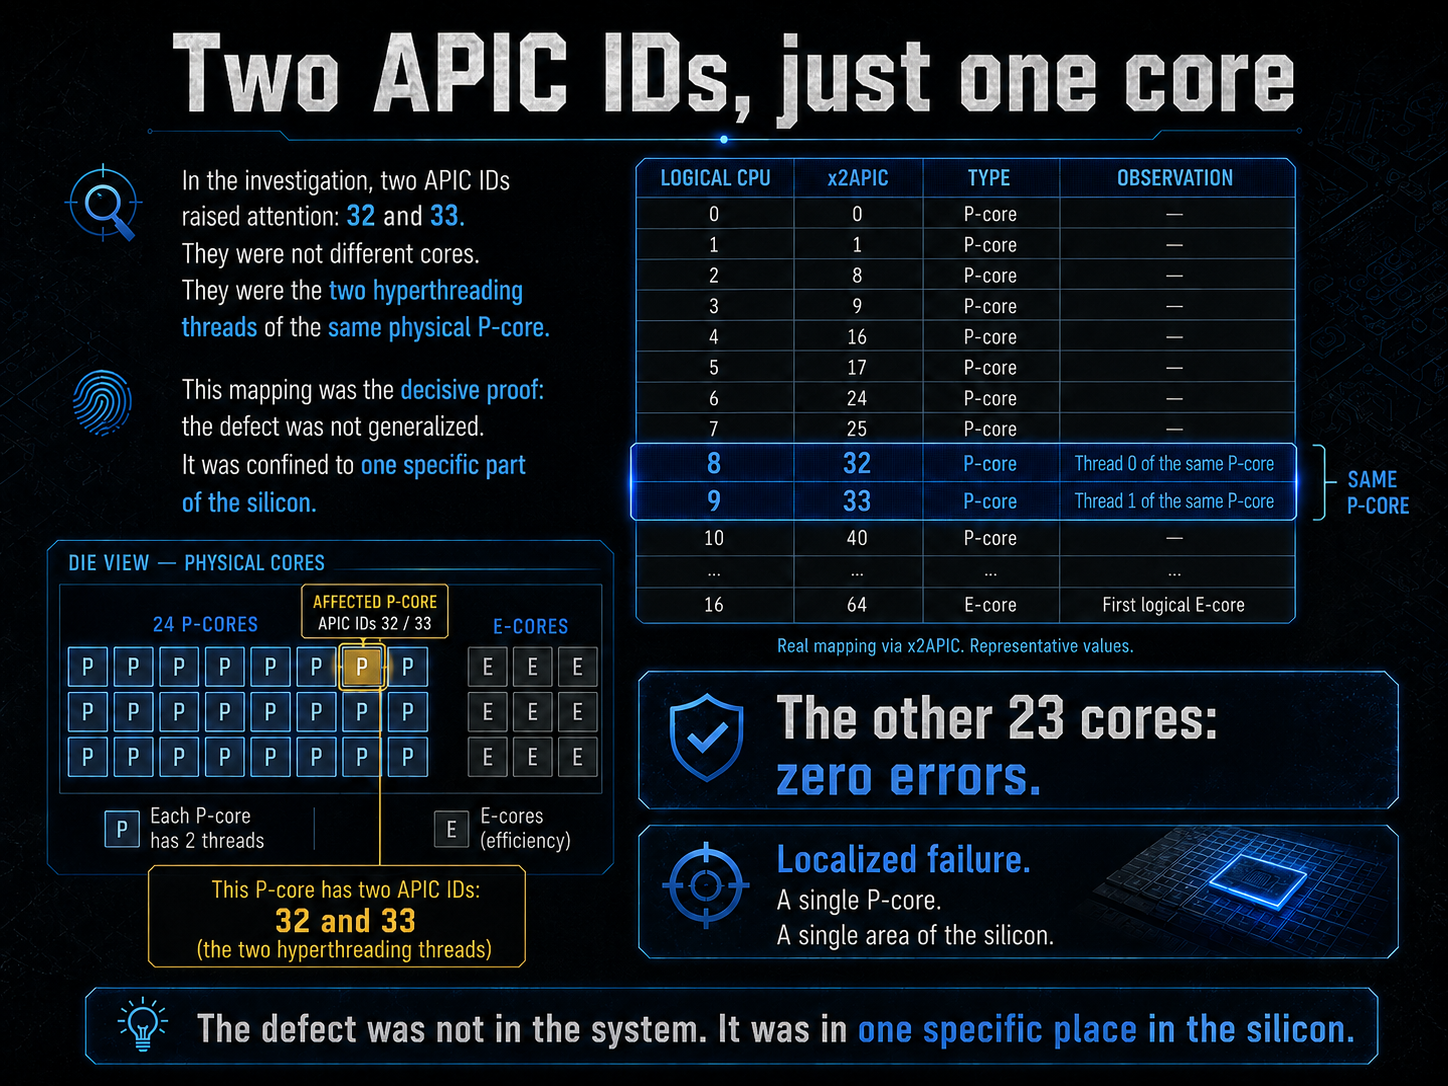
Next question: which physical core owns APIC IDs 32 and 33? You can’t assume the mapping — logical CPU numbers, APIC IDs and physical cores are three different numbering schemes on hybrid Intel parts. So I asked the CPU directly: a small console program that walks all 32 logical processors, pins itself to each one with SetThreadAffinityMask, and executes CPUID — leaf 0x0B for the x2APIC ID, leaf 0x1A for the core type. The output:
Logical CPU   x2APIC   Type
     0           0     P-core   <- P-core 0
     1           1     P-core
     2           8     P-core   <- P-core 1
     3           9     P-core
     4          16     P-core   <- P-core 2
     5          17     P-core
     6          24     P-core   <- P-core 3
     7          25     P-core
     8          32     P-core   <- P-core 4  *** here ***
     9          33     P-core   ***            and here ***
    10          40     P-core   <- P-core 5
    ...
    16          64     E-core
    ...
APIC 32 and 33 are the two hyperthreads of the same physical P-core — the fifth one. All 27 machine check errors, both error types, months apart, on one core out of twenty-four. The other 23 cores: zero errors. Not fewer. Zero.
The raw machine check record from the worst day makes it even more specific:
ApicId   = 33
MCABank  = 0                      (Instruction Fetch Unit)
MciStat  = 0x8000004000050005
Decoding that status register: valid record, error corrected, MCA error code 0x0005 = internal parity error, reported by Bank 0 — the instruction fetch unit. The part of the core that reads instructions from memory before executing them was, occasionally, reading them wrong. Keep that detail in mind; it pays off in a minute.
The crash dumps had been saying the same thing all along
Armed with a theory, I went back to the five minidumps with WinDbg (!analyze -v, public Microsoft symbols). Now the “five different stop codes” stopped being noise and became the signature. Three of the dumps are little masterpieces of hardware-failure forensics.
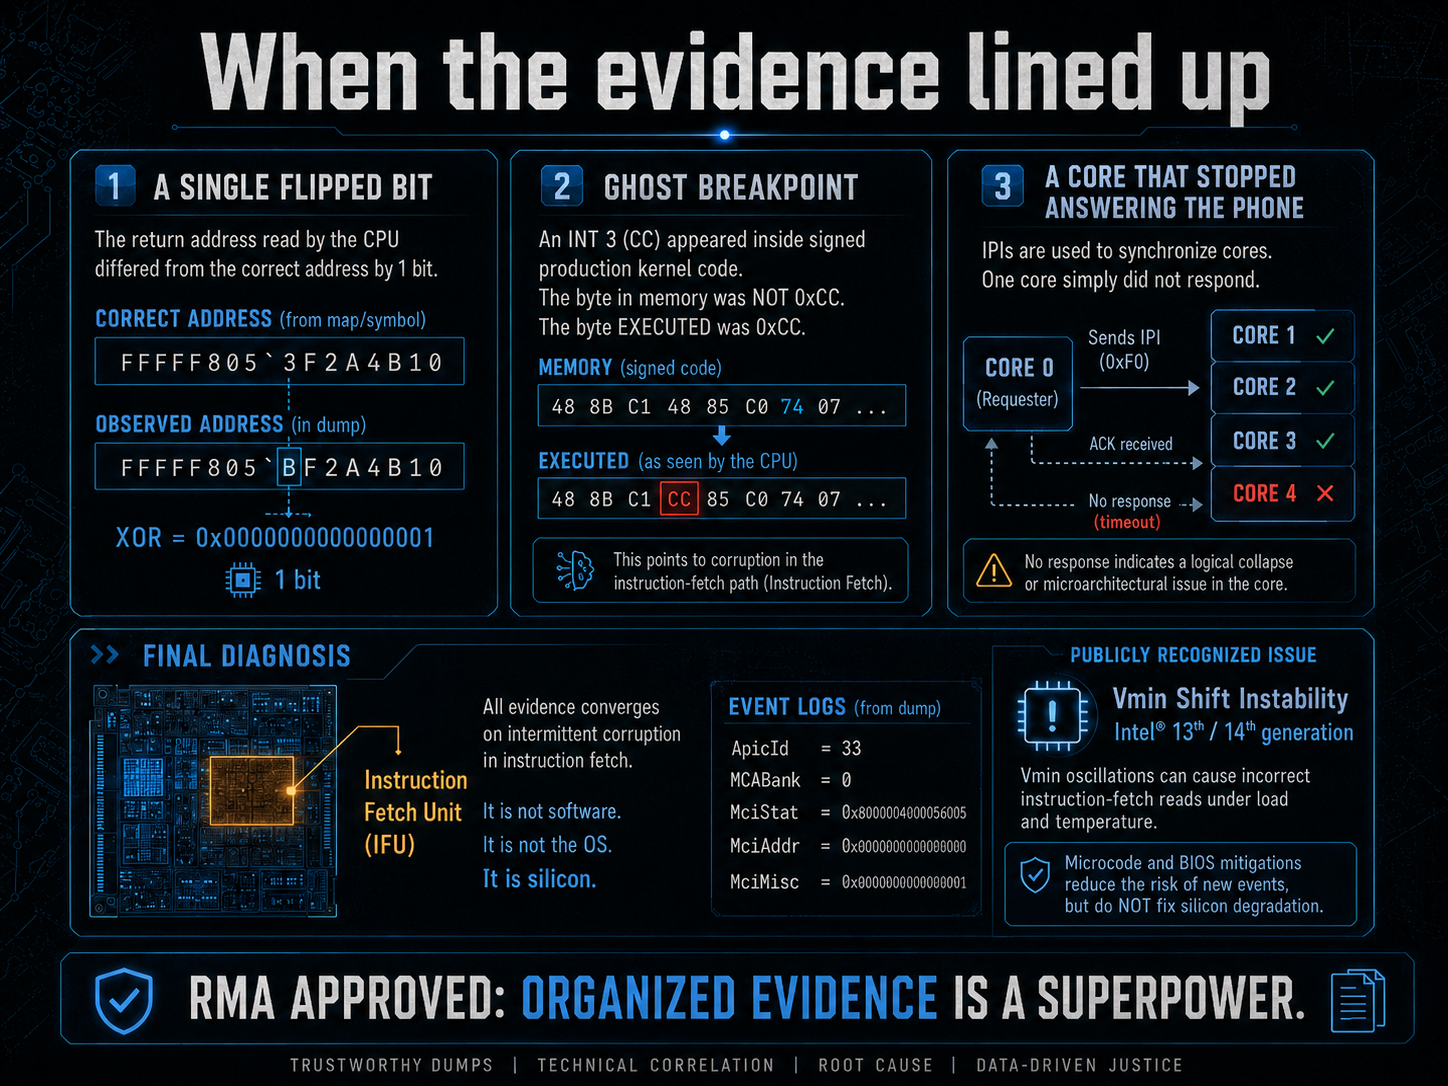
Exhibit one: a single flipped bit. The March crash was a page fault in Ntfs!NtfsContinueIndexEnumeration. Look at the address the code tried to reach versus the address it should have used:
referenced address : fffff802 aed92e50
correct address    : fffff802 2ed92e50
                              ^
XOR                = 0x0000000080000000   -> exactly one bit (bit 31)
One bit, flipped, in a computed kernel address. Software does not do that. Software bugs give you off-by-ones, use-after-frees, null dereferences — patterns with logic behind them. A single-bit flip in an address is arithmetic going wrong inside the processor.
Exhibit two: a phantom breakpoint. The April crash was STATUS_BREAKPOINT — an INT 3 instruction executed inside Microsoft-signed NTFS kernel code. There are no breakpoints compiled into shipping kernel code. Which means the bytes the CPU executed were not the bytes stored in memory: the instruction stream got corrupted somewhere between fetch and execution. Corrupted where? The instruction fetch unit. The exact unit MCA Bank 0 had been filing parity errors against. When two completely independent sources of evidence point at the same functional block, you can stop calling it a theory.
Exhibit three: a core that stopped answering the phone. The August crash stack shows processor 29 sending an inter-processor interrupt and waiting forever in KiIpiStallOnPacketTargetsPrcb for a target core to acknowledge. It never did. The NMI watchdog fired and took the system down. A core that goes deaf to IPIs has locked up at the hardware level.
Killing the last alternative explanation
One loose end bothered me: two of the five crashes were in the same NTFS function. That repetition allowed a boring explanation — a corrupted Ntfs.sys on disk, or a failing SSD. So I tested it. chkdsk /scan: filesystem clean, zero bad sectors across three million file records. sfc /scannow: found exactly one unrepairable file on the entire system — a PNG icon belonging to the high-contrast theme. Ntfs.sys itself: verified intact, not one mention in the CBS log.
And note the causality: this machine had suffered a string of dirty shutdowns. If anything, crashes cause disk corruption — not the other way round. Even that hadn’t happened. Alternative hypothesis: dead.
Naming the villain
If you followed hardware news in 2024, you already know where this lands. Intel’s 13th and 14th gen Core processors have a publicly acknowledged degradation failure mode — Vmin Shift Instability — where sustained elevated voltage physically ages the silicon until the minimum stable voltage of the fastest cores drifts out of spec. The i9-14900K is the most affected SKU. Intel shipped microcode mitigations and extended the warranty on affected chips to five years.
My board was already running microcode 0x12F — the latest, with every mitigation applied. The errors kept coming anyway, because the mitigations prevent future damage; they can’t heal silicon that has already degraded. And the trend line was exactly what degradation looks like: one corrected error in early July, eleven on one day in mid-July, sixteen on a single day in August — including a burst of eleven parity errors within one second. The core wasn’t just failing. It was failing faster every week.
It also fits that the victim was a P-core. Vmin Shift hits the high-frequency performance cores — the ones that boost hardest. My chip’s fifth P-core simply drew the short straw.
The RMA, or: evidence is a superpower
I bundled everything into a report: the WHEA timeline, the APIC-to-core mapping, the decoded machine check registers, the dump analyses, the chkdsk/sfc rule-outs. Then I opened a warranty ticket with Intel and pasted a summary that led with the one killer fact: 27 machine check errors, 100% of them on the two SMT threads of one physical P-core, on current microcode.
I’d braced for the first-line support script — reset your BIOS, test your RAM, reinstall Windows. It never came. Intel reviewed the material and confirmed the processor as defective the next day. RMA approved; the replacement chip is on its way as I write this.
I don’t think I got lucky. I think support engineers, like the rest of us, move fast when someone hands them a case that’s already solved and shows the work.
What I’d tell past me
Crashes that never repeat the same way aren’t noise — the inconsistency itself is data. Software fails with a pattern; hardware fails everywhere at once. And before blaming components you can’t see into, check whether the CPU has been filing error reports about itself: WHEA-Logger, Event ID 19, System log. Corrected machine checks are silent — no crash, no popup — and they’re often the earliest warning you’ll ever get that silicon is dying. Mine had been quietly documenting its own decline for six weeks while I was busy accusing the RAM.
The machine knew. It’s usually just a matter of asking.